top of page


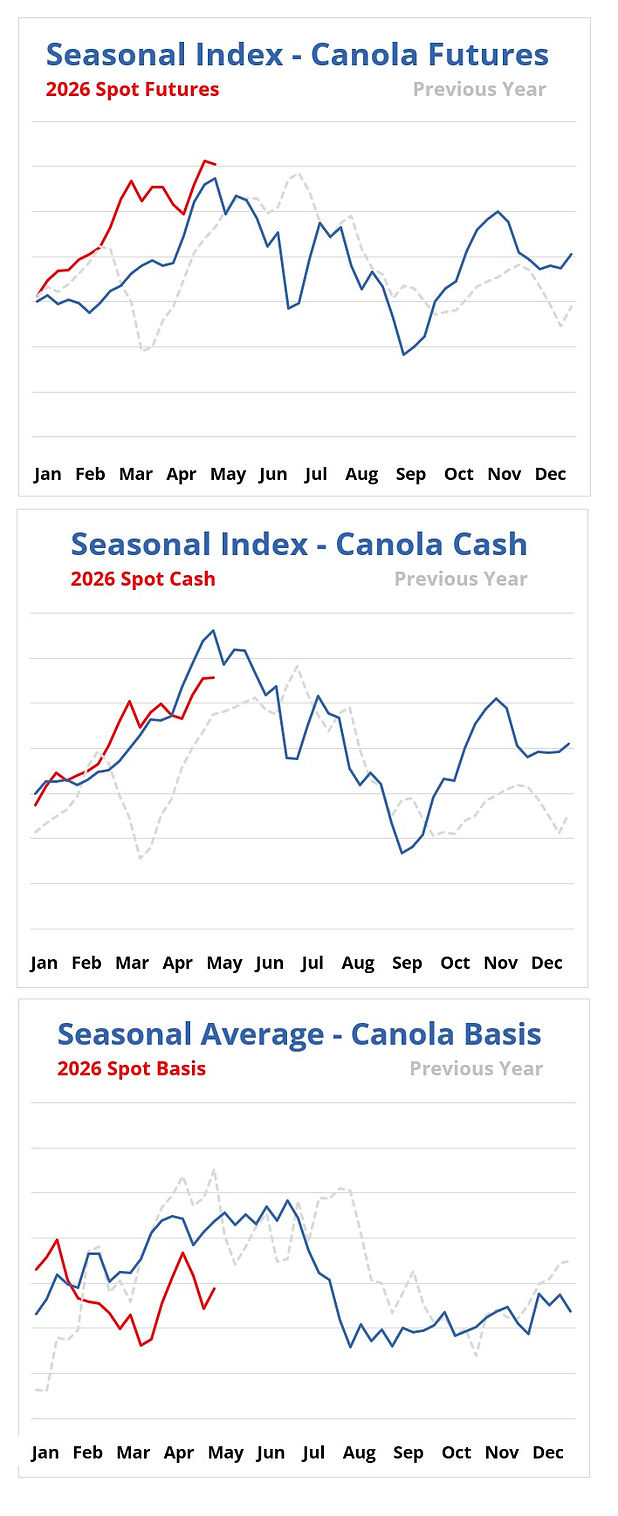
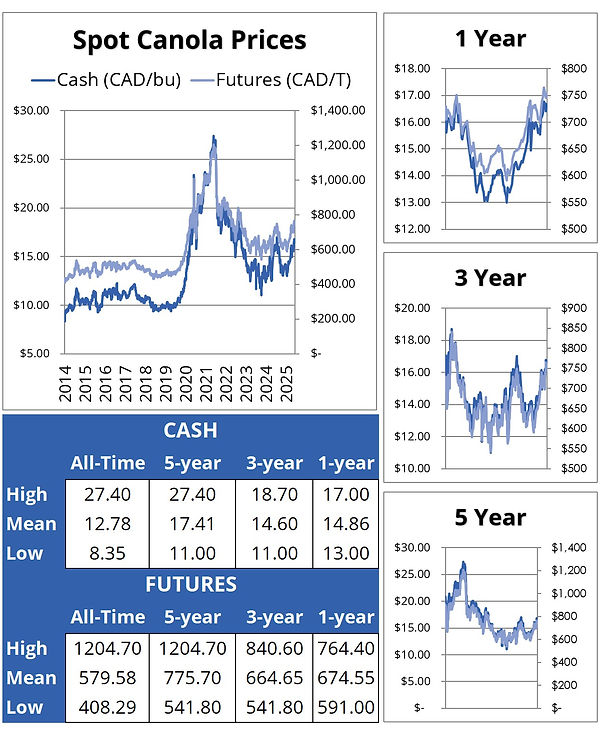
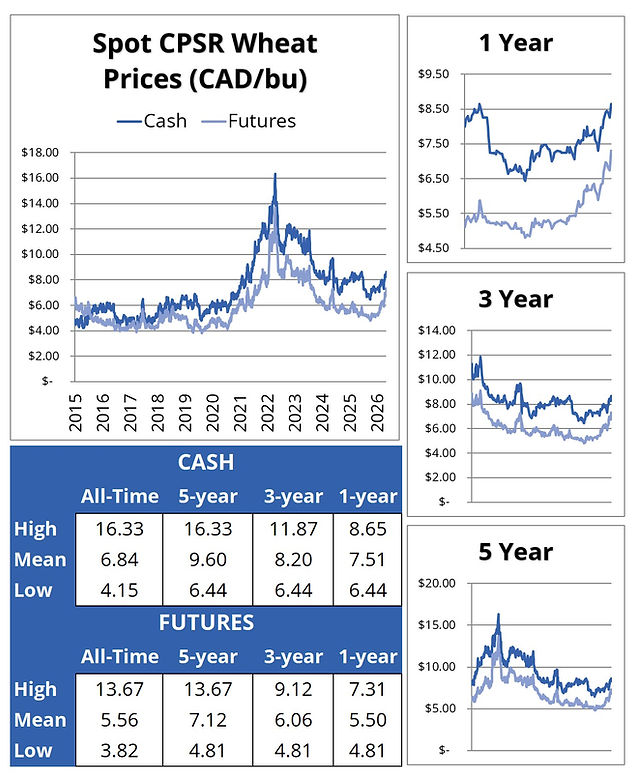
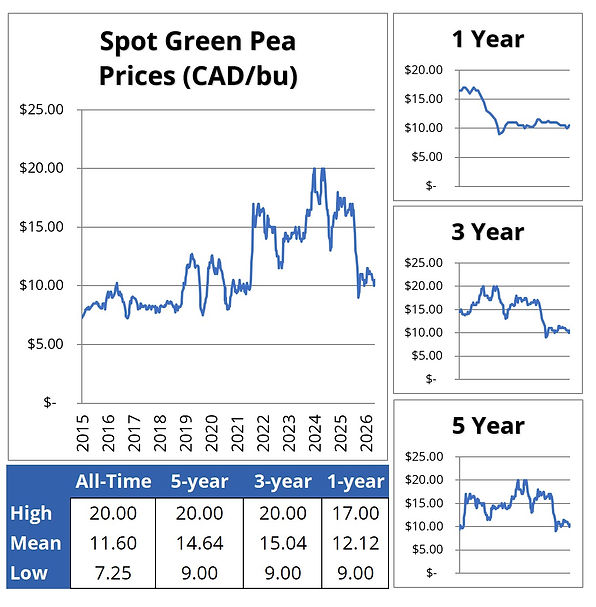
Historical prices are based on our average price collection. They are not specific to one area but still provide a good sense of the range & trend for 1 year, 3 years, 5 years, and all-time. The seasonal index line is on a scale from 0-100%, while the spot & last year prices are based on the average price collection. The values are omitted from the vertical axis on the seasonal charts because it is more valuable to see how closely the red line (current year) is tracking the blue line (seasonal). The index is designed to provide seasonal windows to watch prices.
c


bottom of page